Recently I learned, that it’s possible to script IntelliJ. I picked up on it while Writing an IntelliJ Plugin for my Coverage Tracker project, aka “Undercovered”. So there is the IDE scripting console, which comes out-of-the-box. You just open the Action panel and search for IDE Scripting Console, next a tiny popup menu should show, asking for whether it should be Groovy or Kotlin (beta). Right away you can enter some code and evaluate it by pressing Control + Return.
Furthermore there is a Plugin called Flora, which is also in beta state. So far that’s rather a Hackathon project, but besides Kotlin, promises to support JavaScript. However I never got it to work, TBH.
And then there is LivePlugin, which after all has 72k downloads currently … and IMHO works pretty well. It also allows scripting in Groovy and Kotlin. Furthermore it comes with some handy functionality to pull such scripts (or “Live Plugins”) from GitHub Gist and also share them to there. It also has start & stop buttons and offers to run scripts during IntelliJ startup.
What to do with it !?
You have full access to IntelliJ’s API after all 🙂
You can register your own actions. You can run whatever actions. You can show messages. You can add your own intentions. You can add your own inspections. You have access to the indexing data, aka Program Structure Interface (PSI). You can do a whole lot.
For some more inspiration check out the examples from LivePlugin GitHub or further examples linked from their README.
What did I do with it !?
I regularly have to do with Camunda BPMN process definition files (which are XML files), which declare so-called service tasks, that delegate execution to Java. The calls go to @Named CDI Beans.
In order to test those files, you create a new test file (with a name related to the name of the .bpmn file), and provide @InjectMocks lines for each and every one of these tasks. Importing the correct class etc. Pretty tedious. Rather boring.
So why not automate that!? with access to PSI it should be pretty simple to fine the classes annotated @Named, having either the name explicitly or implicitly. So I went ahead and (to be honest in full Vibe Coding mode with support from Claude Sonnet 3.7) churned out my first personal IntelliJ action 🥳
… and well, yes, indeed it’s pretty simple.
Registering an Action
… after all pretty straight forward.
I just (initially) struggled with it not showing up in the Action Popup 🤔 … the interesting bit: it showed up in the Keymap dialog, so I could add a keyboard mapping and run it using that. It just wasn’t selectable from the action panel.
The problem: I didn’t call the super constructor providing a name 🙈
class BpmnFileAction extends AnAction {
    BpmnFileAction() { super("Create Test for .bpmn File") }

    @Override
    void actionPerformed(AnActionEvent event) {
        // implementation goes here
    }
}

ApplicationManager.application.invokeLater {
    def actionManager = ActionManager.instance
    actionManager.replaceAction("BpmnFileAction", new BpmnFileAction())
}
Querying PSI
Looking for @Named classes with explicit names, e.g. @Named("whatTheHeck"):
def javaPsiFacade = JavaPsiFacade.getInstance(project)
def namedAnnotationClass = javaPsiFacade.findClass("jakarta.inject.Named", GlobalSearchScope.allScope(project))

if (namedAnnotationClass) {
  return AnnotatedElementsSearch.searchPsiClasses(namedAnnotationClass, GlobalSearchScope.projectScope(project))
  .findAll { psiClass ->
    def annotation = psiClass.getAnnotation("jakarta.inject.Named")
    def value = annotation?.findAttributeValue("value")
    value?.getText()?.replace("\"", "") == namedValue
  }
}
… and looking for plain @Named classes is even more straight forward:
def javaPsiFacade = JavaPsiFacade.getInstance(project)
def namedAnnotationClass = javaPsiFacade.findClass("jakarta.inject.Named", GlobalSearchScope.allScope(project))

if (namedAnnotationClass) {
  return AnnotatedElementsSearch.searchPsiClasses(namedAnnotationClass, GlobalSearchScope.projectScope(project))
  .findAll { it.name == capitalizedName }
}
Here’s the current (final ?!) version I came up with
Developer Experience
The DX with these “Live Plugins” in my opinion isn’t great – in Java Land you’re used to using a proper debugger. And that’s just not available. Since the Code is sourced into the running IntelliJ instance, you cannot just attach a debugger and stop execution.
For the “LivePlugin” plugin there even is a bug report Run a plugin in Debug mode dating from October 2013 🙂
I personally resorted back to println debugging and tailing IntelliJ’s application log file ~/.cache/JetBrains/IntelliJIdea2024.3/log/idea.log … where the print outputs shows up. Mainly since I was developing off the “LivePlugin”, but solely using IntelliJ’s own “IDE Scripting Console”.
That said, when using LivePlugin, there is another option: PluginUtil, which ships a large number of utility functions. Among them are showInConsole, which opens a console window … suitable to dump an exception. Also there is inspect, which takes a single argument and opens a popup, allowing to inspect that given object.
Code Completion → Adding IDE Jars
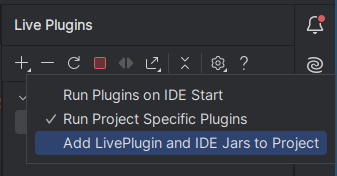
The LivePlugin also offers to add IDE Jars to the active project. This is very helpful to get code completion.

… however when trying to use Java Plugin APIs (for example if you try to query Psi for Java Annotations), that’s not enough. To add that as well, do the following:
locate the
java-impl.jarfile from the IntelliJ Java Plugin on your disk; having installed IntelliJ via their Toolbox, it’s located in my home directory under.local/share/JetBrains/Toolbox/apps/intellij-idea-ultimate/plugins/java/lib/java-impl.jargo to the Project Tool Window and locate “External Libraries”
right at the top there should be an entry “LivePlugin and IDE jars (to enable navigation and auto-complete)”, right-click that an choose “Open Library Settings”
that should open the “Project Structure” window and auto-select “LivePlugin and IDE jars (to enable navigation and auto-complete)” … once more right-click here and select “Edit” this time …that should open “Configure Module Library” window
click the “+” Button there and locate the file from Step 1
… and done 🙂